


Access analytic tools to transform laboratory data into actionable intelligence, empowering stewardship, optimizing utilization, and driving strategic decision-making.

Solutions for Laboratory Analytics
ARUP offers two lab analytics solutions that feature intuitive visuals and reporting options to help you make timely decisions and focus on cost savings through utilization management.

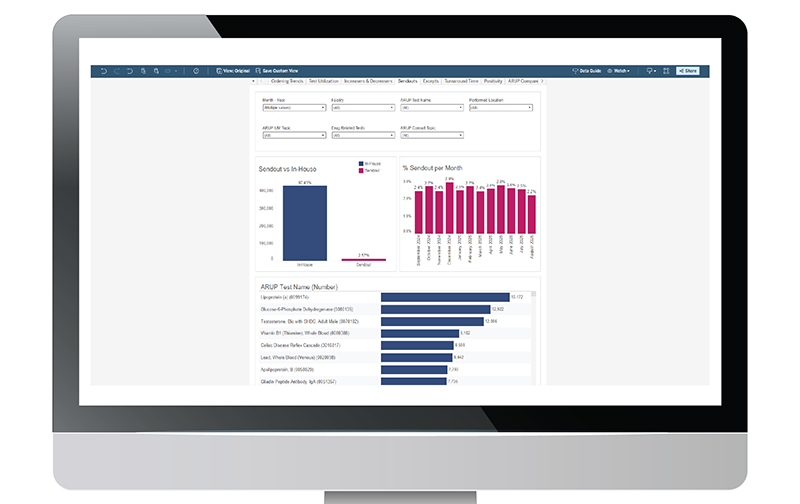
AnalyticsDx™ Sendout
Our no-cost analytics dashboard delivers a clear, data-driven view of all testing referred to ARUP, empowering smarter decisions and cost-effective operations.
- Comprehensive oversight: Monitor utilization, quality assurance metrics, and sendout trends in one centralized dashboard.
- Performance tracking: Assess test volumes, spending patterns, turnaround times, and exception rates with precision.
- Clinical insight: Evaluate positivity rates and identify opportunities to improve ordering practices.
- Strategic optimization: Uncover potential insourcing opportunities and areas for stewardship to reduce unnecessary costs and enhance efficiency.

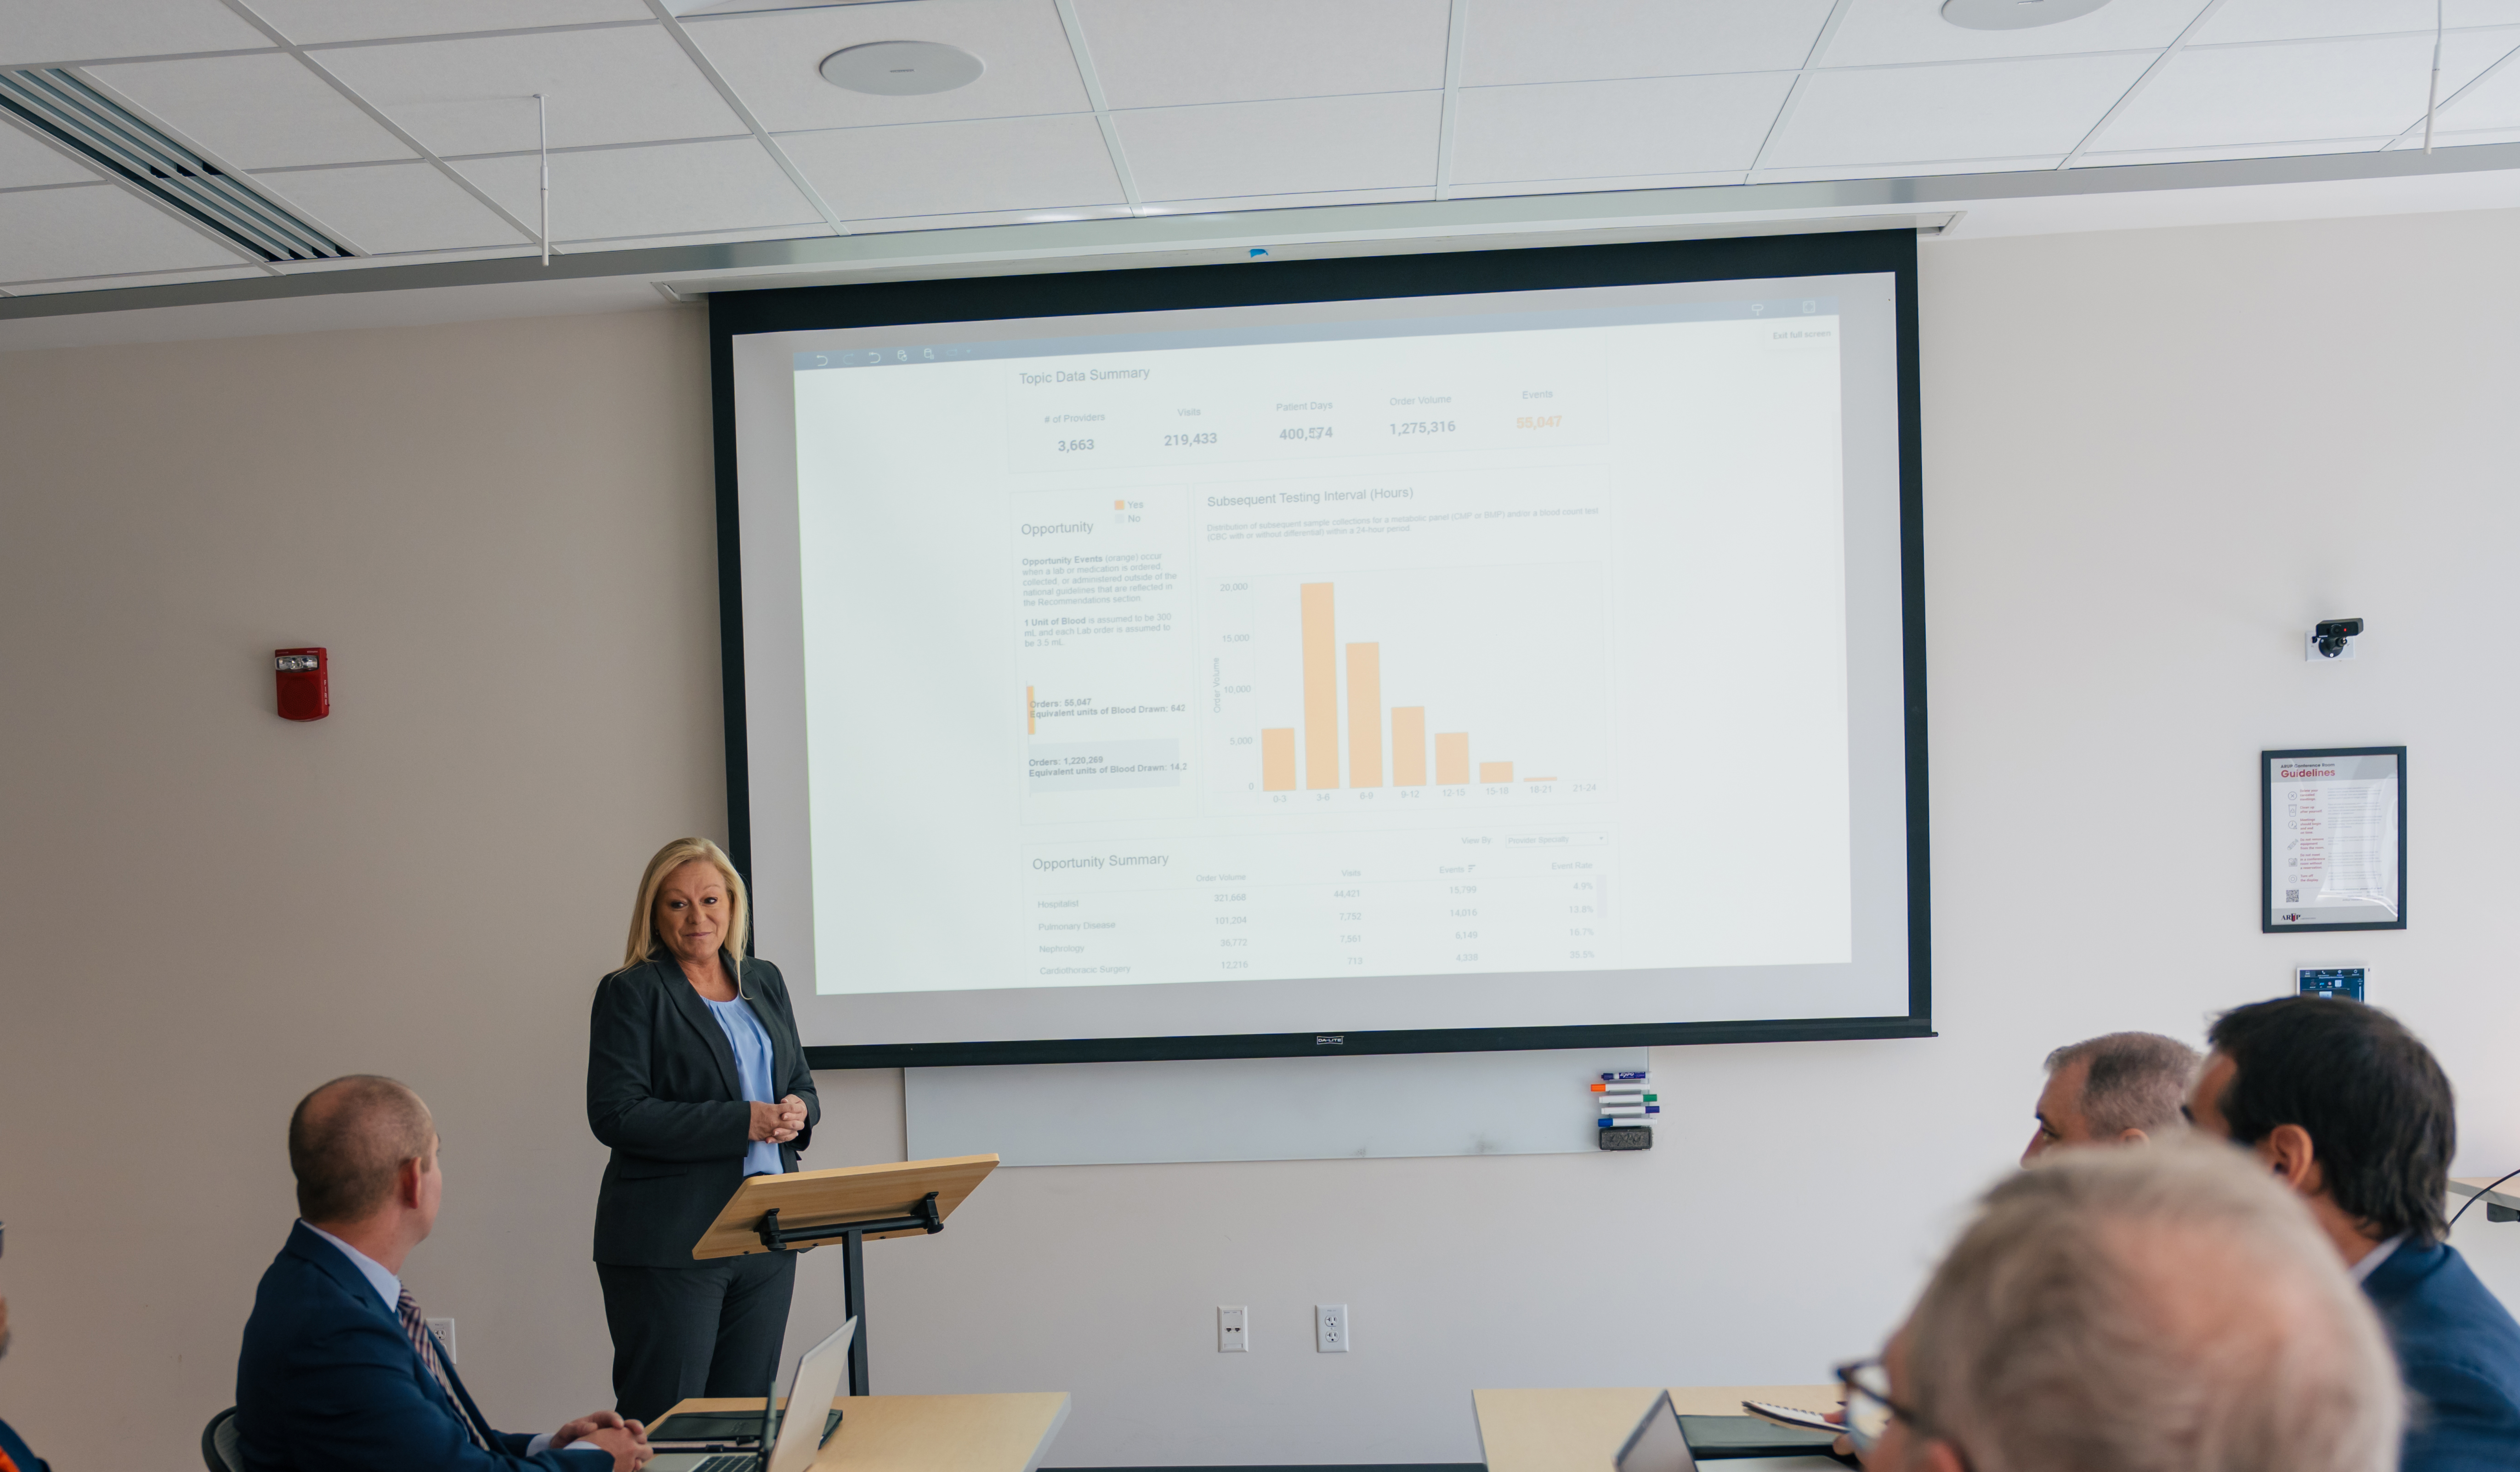
AnalyticsDx™ Comprehensive
A unified, secure, HIPAA-compliant platform that consolidates inpatient, outpatient, outreach, and sendout data to empower smarter, value-based decisions.
- Single source of truth: Review statistics for all diagnostic testing in one secure location.
- Granular insights: Filter by diagnosis-related group (DRG), provider, patient type, and other key metrics to pinpoint trends and opportunities.
- Stewardship and strategy: Identify misutilization, reduce clinical variation, and uncover actionable recommendations for cost savings and quality improvement.
- Integrated guidance: Access ARUP Consult® links and decision support tools directly within the dashboard for immediate clinical context information.
Analytics: The ARUP Advantage
As your reference laboratory partner, ARUP is dedicated to helping you strengthen your laboratory’s service and operations by keeping testing close to the patient while contributing to systemwide revenue growth. Our laboratory analytics tools were developed to achieve these goals through optimizing utilization and containing costs while doing what’s best for the patient.
Explore Further
Manage your referral testing with test selection and directory resources and a variety of valuable reporting tools.

Create an effective laboratory stewardship program to eliminate waste, reduce costs, and improve patient care.

Revitalize your cost structure, increase your net margin, and improve your entire revenue cycle.