


“Hospitals are increasingly being told to make more of their big data,” says Ben Chacon, a senior healthcare consultant and the Dashboard product manager. “And they are asking ‘How?’” ARUP recently rolled out their next generation UM dashboard for clients hospitals and healthcare organizations that will allow them to further mine this data and make it actionable.
Since 2016, when these client-tailored UM dashboards were first introduced, Chacon and his colleagues on ARUP’s Consultative Services Team have continuously identified new ways for clients to identify patterns and outliers in their reference tests data and then provided UM Dashboard decision support tools that assist clients on how to improve. “Yes, this makes a difference to the bottom line, but, more importantly, it affects patients’ lives,” adds Chacon. It is estimated that some 70 percent of medical decisions are based on laboratory test results.
New Dashboard Features & Why They Matter
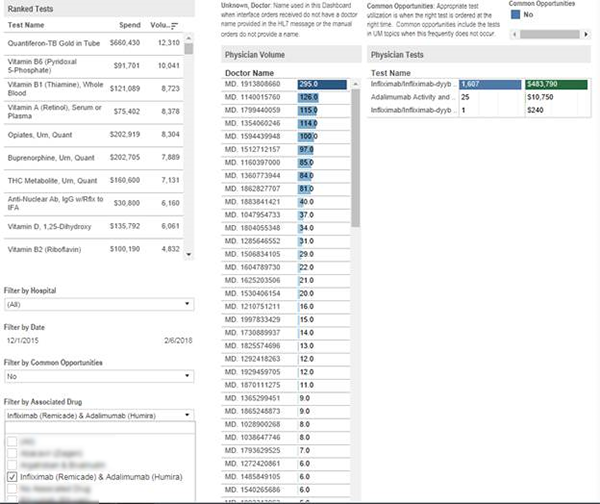
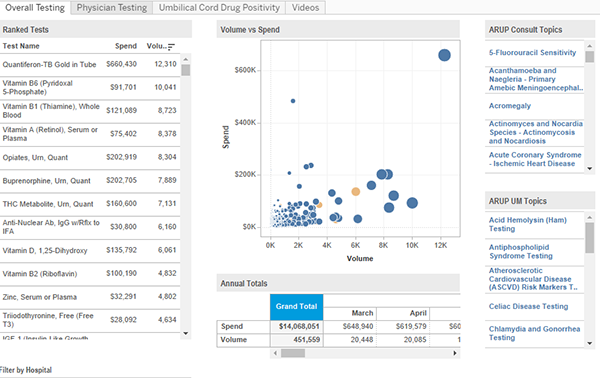
The Physician Testing tab has a new pharmacy filter that will identify lab tests associated with a number of pre-selected therapeutic drugs. This is helpful in showing which laboratory tests correlate with specific therapeutic drugs. A user can select one of the pre-selected therapeutic drugs and view the laboratory test’s volumes and costs. The savings becomes obvious when you consider that a full dosage cycle of a drug may run $100,000; if it is a five-dose cycle, then each dose runs $20,000. An associated lab test ($100) can be used partway through the treatment cycle to see if the drug is effective. Has the patient built up antibodies to it? If yes, then the physician can review other treatment options; this not only saves up to $60,000 in drug expenses, it also ensures that patients are getting the best treatment for them and not wasting vital time.
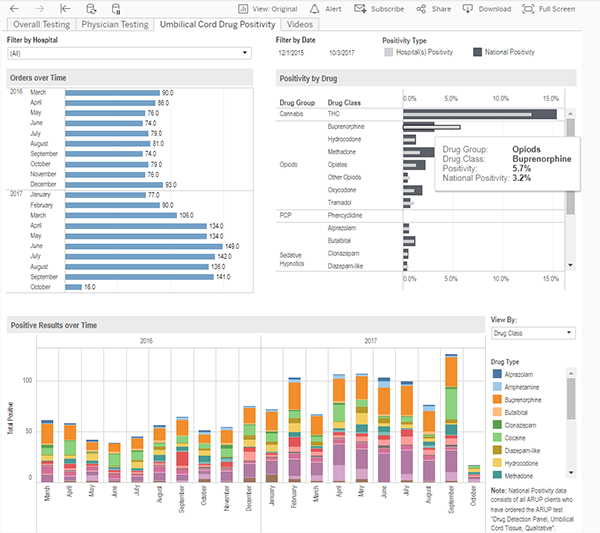
The Cord Testing Positivity Rates tab compares and benchmarks hospitals results vs national averages (based on accumulated results in ARUP’s databank). By using the umbilical cord as the specimen, this tab shows what drugs babies have been exposed to—the cord is analyzed for more than 20 specific drug and drug metabolites. This information can be helpful by raising awareness if certain drugs are notably higher than the national average, perhaps indicating a deeper issue. For example, a community infiltrated by the opioid crisis. ARUP was the second lab in the nation to begin offering cord testing.
The Dashboard now includes ARUP Lab Minute, an evolving library of short videos about specific laboratory tests and best utilization. In these videos, Consultative Services medical director Andrew Fletcher, MD, focuses on tests that are often misunderstood or confused with other tests. He knows firsthand how easy it is for test ordering to devolve into misutilization. Previously, he worked at Mountain States Alliance, where he developed a lab utilization program that captured more than $1 million in cost savings within the first year.
In each video, he delivers lasting clarification in under two minutes. Topics range from PSA testing to vitamin D deficiency testing, among others. “We know that physicians don’t have much time, so this is information that cuts to the chase:we basically say, ‘here are three things you need to know about this test’,” says Fletcher.
This article covers most of the highlights on the newly released dashboard. New features are currently in the works to continuously improve the UM Dashboard based on client feedback.
The answers to improved patient care and cost savings are buried in the massive amount of accumulated patient data. The Consultative Services team knows how to develop the tools to turn this data into solutions. “Some hospitals don’t have the extra resources and expertise to look at all that data and extract what matters. We do,” says Chacon.
Peta Owens-Liston, ARUP Science Communications Writer
Related blogs