


Achieving Six Sigma Levels in the Laboratory: Here's What We Learned
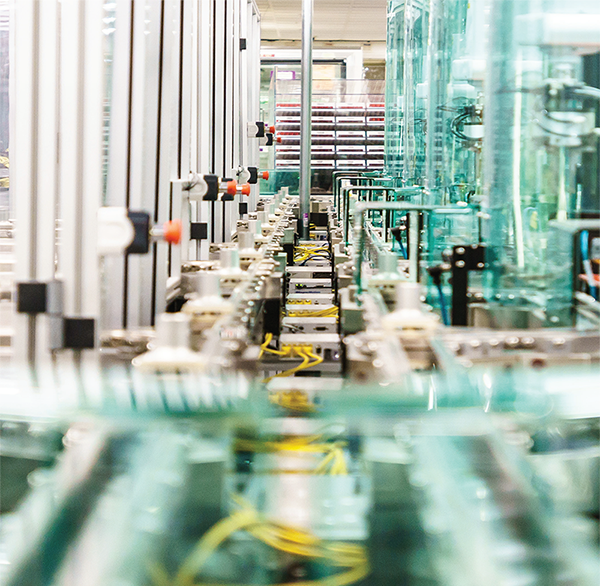
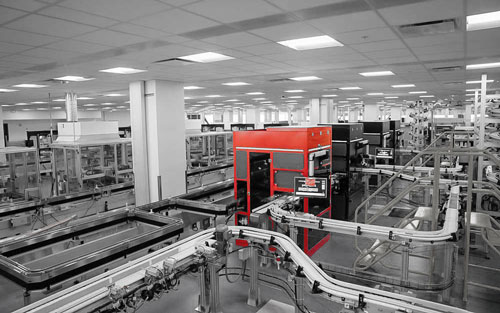
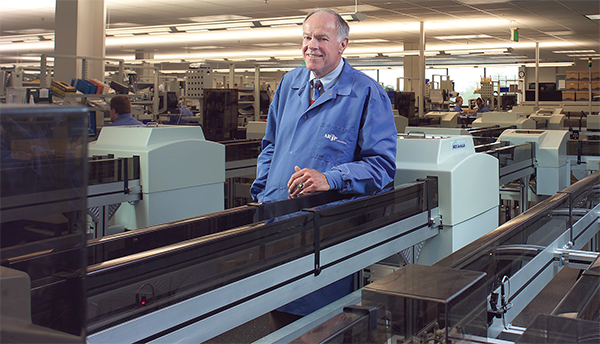
Inside ARUP’s main building in Research Park, near the University of Utah, hundreds of specimen-filled pucks zoom along an automated track system, moving up to six feet per second on their way to roboticlike machines that will help sort them according to their appropriate laboratory and specimen environment.
In-house IT and mechanical engineers have customized the automation system to ensure reliability (less downtime), expedite processes (faster turnaround time), and provide the opportunity to improve quality and reduce errors (fewer lost specimens, and less mislabeling and missorting).
Wouldn’t you love to fly on an airline that loses fewer than four pieces of luggage for every million pieces it transports? Not bad odds. In the field of quality, this level of performance is considered “world class quality,” and the Six Sigma quality method seeks to achieve error rates of no more than 3.4 defects per million opportunities.
This past July, ARUP Laboratories published a report detailing its 25-year journey toward achievement of this prestigious Six Sigma score for lost specimens.
“We found that to achieve this level, a laboratory needs automation,” says Charles Hawker, PhD, MBA, who coauthored the article in the July 2017, issue of Journal of Applied Laboratory Medicine (JALM).
“To my knowledge, ARUP is the first clinical laboratory in the country to achieve Six Sigma quality for any metric,” adds Hawker. For nearly two decades, Hawker has helped develop ARUP’s highly sophisticated automation system, earning him respect worldwide for his expertise in this area.
While the ultimate goal is perfection, particularly in healthcare, making incremental progress toward this goal is the focus of ARUP’s continuous improvement system. In clinical laboratories, mistakes in the analytic area are generally minor contributors to poor laboratory quality and diagnostic error. The majority of mistakes—including lost or misplaced specimens—happens in the nonanalytic processes.
Some 55,000 specimens, destined for testing in 70 specialized laboratories, are processed daily at ARUP, so tracking the precise location of a single specimen is a herculean task. From time to time, one of these samples may lose its way.
“We want to share with other labs ideas that will help them improve their own processes and quality… This is at the heart of this report and is a core part of what ARUP does.”
—David Rogers, Group Manager, Support Serivces/Specimen Processing
The JALM article homes in on lost-sample solutions that involve automation and human behavior controls, but the corporate culture is another important consideration. “It’s a patient-centric culture here; each specimen is a patient,” says David Rogers, who oversees specimen processing and also coauthored the article. Every specimen arriving at ARUP passes through the hands of Rogers’s team members
“We want this report to show other laboratories that they too can strive for this level of quality,” emphasizes Hawker. Readers learn how the automation of nonanalytic processes decreases the number of lost specimens. In addition, the article covers a variety of engineering and behavioral controls, which relate to how humans work, that have played a role in this remarkable achievement.
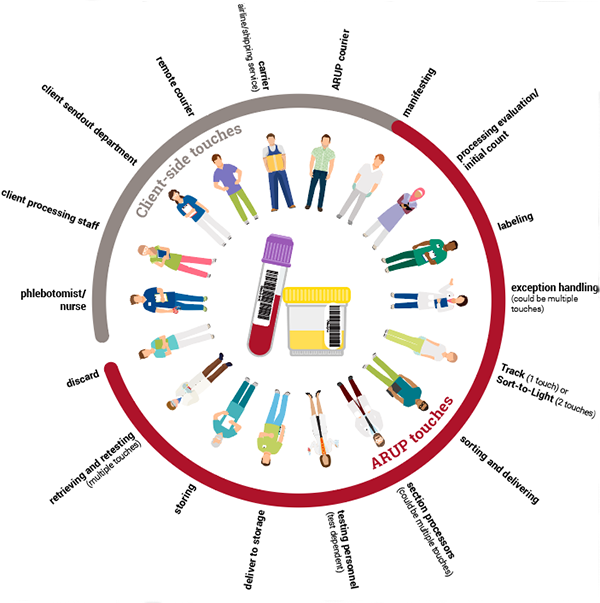
“Every time a human touches a sample, it creates an opportunity for error,” explains Bonnie Messinger, ARUP’s process improvement manager and the article’s lead author. She estimates that a specimen could be handled 20 or more times from the point it leaves the client until it is discarded.
The Human Touch: Following the Handling Path of a Specimen
Automation Improvements
Using data spanning the 25-year period, the authors show the correlation between lost specimens and the implementation dates for eight major phases of automation, along with 16 process improvements and engineering controls. While implementation of process improvements, engineering controls, and automation all contributed to overall reduction in the lost specimen rate, the data shows that automation was the most significant contributor.
“Every time a human touches a sample, it creates an opportunity for error... A specimen could be handled an estimated 20 or more times from the point it leaves the client until it is discarded.”
—Bonnie Messinger, Process Improvement Manager
Examples of automation improvements include the addition of a Sort-to-Light System (S2L) in 2009–10, an automated specimen sorting system for manually managed specimens (15–18 percent of ARUP’s specimens). Prior to implementing, technicians were required to read an abbreviated destination printed on the specimen label and sort these specimens by hand. As might be expected, specimens were occasionally mis-sorted, leading to a higher potential for loss (and were compromised when sorted for storage at incorrect temperatures). The S2L system had an immediate and significant effect on the lost specimen metric, cutting the number of errors per million samples by half.
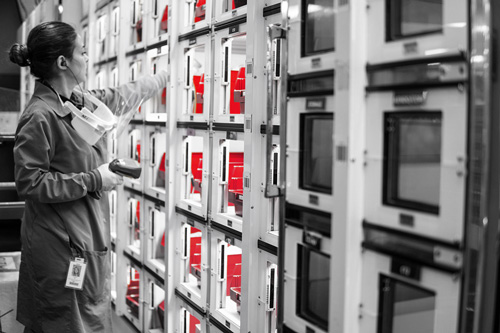
Another improvement was the installation of a two-story freezer in 2003, which holds more than two million specimens. It uses a robotic system and custom software to control access to the specimens and their storage trays, reducing the incidence of handling errors and premature discards.
Prior to installation, trays were stacked several layers deep on shelves, and specimens sometimes fell through and under the shelving. The manual process for discarding trays was likewise prone to error—trays were, on occasion, discarded prematurely.
In the centralized freezer, a robotic system loads and unloads trays from storage shelves, and a Motoman robot retrieves requested tubes from trays. In order to retrieve specimens, employees have to scan their IDs, providing a tracking history.
ARUP’s automation kicked off in 1998, as demand and growth accelerated. “This growth would not have been possible without automation,” says Hawker, who was tracking various metrics at that time.
With each automation enhancement, lost specimen rates decreased. It did not happen immediately, but over the succeeding months, each new level of automation led to improvement. Because the automation stages and various process improvements overlapped, it was not possible to look at any particular stage or process enhancement in isolation, but collectively, the various changes have produced a nearly 100-fold improvement in the lost-sample Six Sigma metric.
Error-Proofing and Human Behavior Management
Human behaviors are influenced by process and engineering controls. In collaboration with ARUP’s in-house engineering team, zeroing in on relatively small modifications to the work environment proved to be quite effective.
For example, to prevent test tubes from rolling off the work surface, raised edges were implemented on all workbenches and workstations. In addition, to keep specimens from being accidently discarded with the transport bag, all waste receptacles were moved away from the primary work area and fitted with rounded covers that included narrow, diagonal openings, so any item placed into them had to be put there intentionally.
“We have 18 different behavioral management strategies—ways of encouraging certain behaviors and preventing others,” says Messinger. Such changes can be very simple, such as encouraging people to keep their work areas uncluttered or establishing a lost-sample checklist.
Messinger explains that in the past, each section had a haphazard method of looking for missing samples. Now, many labs have their own custom checklist that details specific locations to be searched. Every time a sample is found in a new location, the checklist is reviewed and updated if necessary.
Another improvement that influenced human behavior and reduced error involved lighting. While looking for causes of labeling errors, employees were videotaped placing labels on specimens at different stations. An improvement team noticed that the lighting intensity differed from one space to the next throughout the receiving area. Lighting was adjusted to eliminate shadows and reduce the likelihood of a misplaced specimen.
Rogers also noted another improvement that was not included in the article, but was piloted in the Specimen Processing area. Management in Specimen Processing and employees in other areas use video recording equipment to enhance the lab’s ability to critically review processes and identify key improvement opportunities. “This also helps staff to detect areas where specimens may be misplaced,” explains Rogers. “Many process improvements have been implemented as a result of lessons learned from observing staff perform routine duties when quality issues arise.”
The article attributes the remarkable decrease in the frequency of lost specimens not to a single intervention,but to a multifaceted, cumulative approach. “Our results demonstrate that two approaches—automation and designed behavioral controls—working together, can yield remarkable results.”
—Bonnie Messinger, Process Improvement Manager
Sharing with Others
The article attributes the remarkable decrease in the frequency of lost specimens not to a single intervention, but to a multifaceted, cumulative approach. “Our results demonstrate that two approaches—automation and designed behavioral controls—working together, can yield remarkable results,” says Messinger.
The article’s coauthors emphasize that even if a laboratory doesn’t have the same level of automation as ARUP, any degree of automation that replaces an error-prone process will help reduce error. They also emphasize that the main purpose of the article is to share stories of success and spread healthcare improvement ideas.
“We want to share with other labs ideas that will help them improve their own processes and quality,” says Rogers, who regularly visits other laboratories as part of an ARUP consultative team. “This is at the heart of this report and is a core part of what ARUP does.”
A Bite-Size Backstory: Six Sigma
A Six Sigma level of performance is known as “world-class quality.” The Six Sigma method originated with Motorola in 1986 and was later adopted by General Electric and other well-established manufacturing companies.
Theoretically, performance expectations are set and then evaluated as a sigma metric, with six-sigma performance as the goal. In practice, the sigma level of quality for a given output or process is better understood as defects per million opportunities (DPMO). To achieve this world-class quality, there must be an error rate of no more than 3.4 DPMO.
The notion of applying Six Sigma quality improvement measurement models to healthcare remains controversial because “the target performance for healthcare is zero error—3.4 healthcare defects per million opportunities is not good enough,” explains Bonnie Messenger, ARUP’s process improvement manager. However, using the Six Sigma metric to compare performance across disciplines and organizations is a recognized way to normalize data and establish comparable benchmarks.
 HOME
HOME