


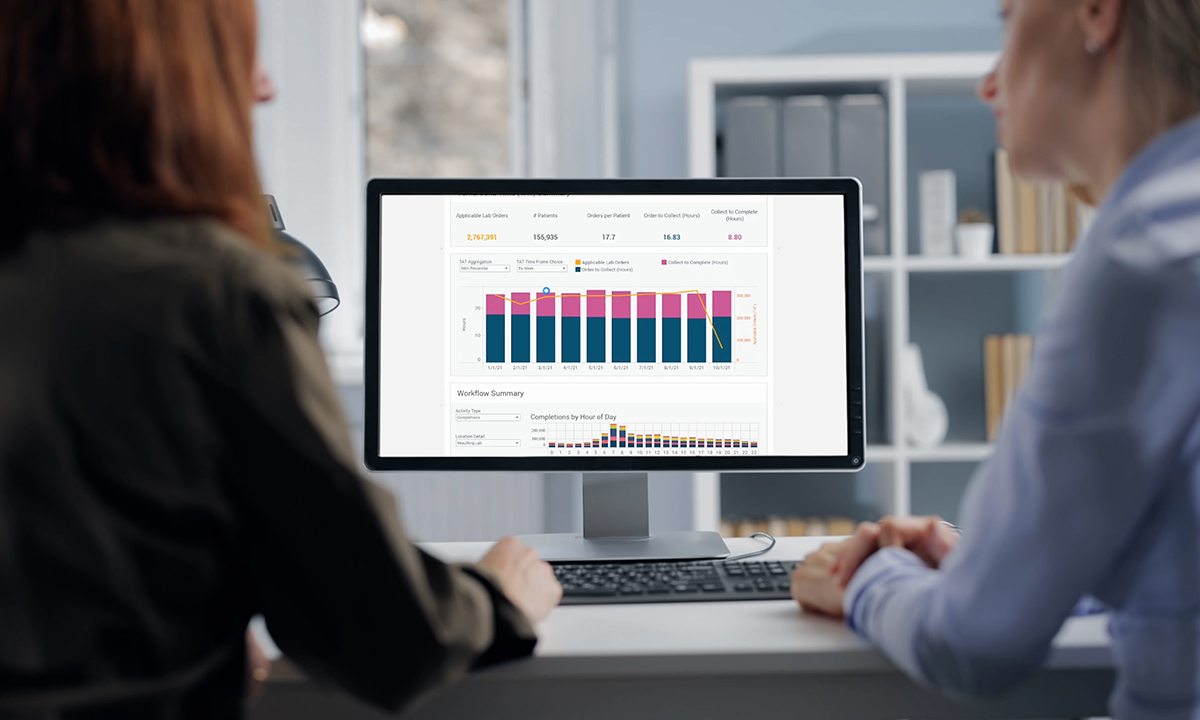
ARUP Laboratories’ new AnalyticsDx™ Comprehensive tool gives laboratories access to their collective testing data in an intuitive dashboard and offers cohesive data visualization for users’ ordering trends, operations metrics, turnaround times (above), and more.
ARUP Laboratories has released a new user tool, AnalyticsDx™ Comprehensive, that vastly improves upon the AnalyticsDx Sendout tool. The comprehensive dashboard allows users to access collective inpatient, outpatient, ambulatory, and referral testing data displayed in a cohesive visualization tool to gain critical lab insights.
Paired with the on-demand expertise of ARUP’s Healthcare Advisory Services team, AnalyticsDx Comprehensive helps users identify opportunities for lasting interventions to reduce inefficiencies, maximize systemwide savings, and promote quality patient care.
“Laboratory data are valuable, but they’re much more valuable when you combine them with other data,” said Sandy Richman, MBA, C(ASCP), director of ARUP Healthcare Advisory Services.
He said that AnalyticsDx Sendout is a valuable tool, but the insights it offers are limited to the testing sent to ARUP. “We know that more than 90% of testing is performed in the hospital laboratory, so the value of AnalyticsDx Comprehensive is providing a tool that captures a complete picture of all the testing performed for a health system’s patients and having it all in one place.”
AnalyticsDx Comprehensive’s improved data aggregation and display enable laboratories to customize detailed, real-time reports on ordering trends and operation metrics to monitor progress toward meeting operational goals. The dashboard’s improvements include additional filters and filter criteria for pages that display overview, operations, topic tracking, order statistics, provider visits, and payer statistics by diagnosis-related group (DRG) data.
By not having to manage countless reports, laboratories can quickly identify utilization and insourcing opportunities using features like the Performing Locations chart.
"The centralization of all testing data allows clients to see if a test can be performed in-house at one of their facilities or consolidated to one sendout location,” said Madeline Green, BS, MB(ASCP), ARUP’s AnalyticsDx product manager. “That’s going to help [laboratories] be more efficient and bring more testing in-house, which is often more cost-effective and better for patient care.”
Clients that adopt AnalyticsDx Comprehensive also are paired with ARUP healthcare consultants who can help engage users and promote greater dashboard utilization. Now, laboratories can pinpoint the root cause of a problem from the data, ARUP healthcare consultants can recommend specific interventions, and laboratory stewardship committees can monitor the effectiveness of the intervention used.
“Our healthcare consultants are the go-to for any clinical questions that a client may have. They will often have a relationship prior to going into the dashboard, so they'll be able to touch on all the [client’s] different needs,” Green said. “It’s why we started the project in the first place.”
For more information about AnalyticsDx™ Comprehensive, visit aruplab.com/consulting/analytics and schedule a custom demo.
About the ARUP AnalyticsDx™ Suite
ARUP Laboratories’ AnalyticsDx suite is the complete, easy-to-access solution for laboratory leaders to achieve more with their data. AnalyticsDx Sendout, a no-cost dashboard for ARUP clients, helps lab managers quickly identify misutilization and savings opportunities for ARUP testing. AnalyticsDx Comprehensive gives laboratories access to ordering trends and operations metrics in a visual, intuitive dashboard for a complete look at their hospital, outreach, and sendout testing data.
Camryn Fife, camryn.fife@aruplab.com